Clients Churn Prediction
Can you predict when a customer is about to churn?
Acquiring a new customer is far more expensive than retaining one. This system helps you do exactly that by ranking the clients most at risk of churning.
Solution
I developed a complete supervised machine learning pipeline — from data preprocessing to model evaluation and interpretability — to predict churn with high precision and recall. The solution integrates classification modeling, business impact simulation, and explainability tools.
Precision‑first churn modeling with real‑world impact: up to 5.8× uplift in retention vs. random campaigns.
How It Works
- Data Preprocessing
- Cleaned & transformed 5K customer records (null resolution, type standardisation, leakage removal).
- Scaled numeric features; encoded categoricals (one‑hot / binary) → compact, sparse‑aware matrix.
- Class imbalance: churn only 14%. Used stratified splits & kept natural ratios (no naive oversampling) to preserve probability calibration.
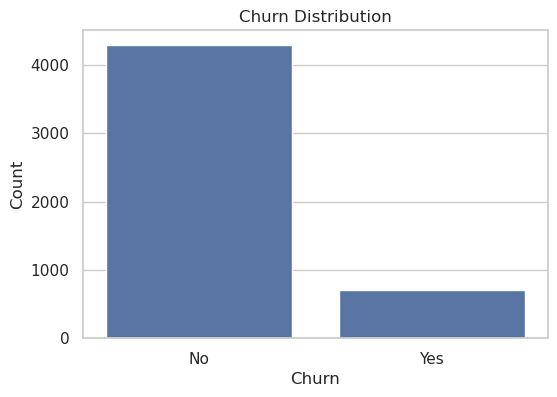
Minority churn class at 14% handled through stratified splitting + calibrated thresholds. - Model Training & Evaluation
- Benchmarked Logistic Regression, Random Forest & XGBoost on identical stratified folds (precision, recall, ROC‑AUC, F1).
- XGBoost led consistently (ROC‑AUC 0.928, Precision 0.94, F1 0.848) while preserving recall.
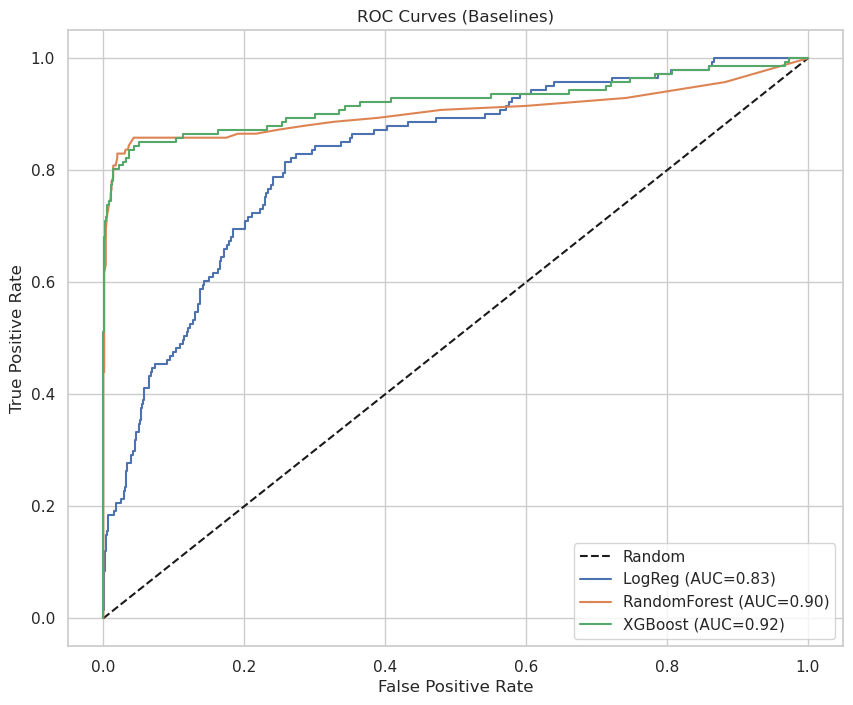
XGBoost outperforms on ROC‑AUC & F1 with strong precision. Validation metrics (identical stratified folds) Metric LogReg RandomForest XGBoost Accuracy 0.8710 0.9560 0.9590 Precision 0.6304 0.9217 0.9167 Recall 0.2057 0.7518 0.7801 F1-score 0.3102 0.8281 0.8429 ROC-AUC 0.8257 0.9049 0.9215 - Hyperparameter Tuning
- Iterative tuning of tree depth, learning rate & regularisation (target: lift precision & AUC without harming recall).
- Result: precision +0.023 with stable recall (‑0.007) and modest gains in AUC & F1.
Untuned vs Tuned XGBoost Metric Untuned Tuned Δ Accuracy 0.9590 0.9610 +0.0020 Precision 0.9167 0.9397 +0.0230 Recall 0.7801 0.7730 -0.0071 F1-score 0.8429 0.8482 +0.0053 ROC-AUC 0.9215 0.9281 +0.0066 - Overfitting
Three diagnostics run before locking the regularised production configuration.
- Train vs Test Metrics – large drops on test indicate overfitting.
Pre‑regularisation: train vs test performance (high‑capacity tuned) Metric Train Test Gap Accuracy 0.9802 0.9610 0.0192 Precision 0.9959 0.9397 0.0563 Recall 0.8640 0.7730 0.0909 F1 0.9253 0.8482 0.0770 ROC‑AUC 0.9956 0.9281 0.0675 Max absolute gap 0.0909 (Recall) → notable overfitting risk.
- K‑Fold Cross Validation (5‑fold stratified) – instability surfaced via mean gaps.
Pre‑regularisation: train vs CV means Metric Train Mean CV Mean Gap Mean ROC‑AUC 0.9974 0.9250 0.0724 Precision 0.9980 0.9308 0.0671 Recall 0.8710 0.7545 0.1165 Largest mean gap 0.1165 (Recall) → capacity reduction & regularisation required.
- Learning Curve (ROC‑AUC) – widening stable gap (train near 1.0, validation lower & flat) confirms model capacity > signal.
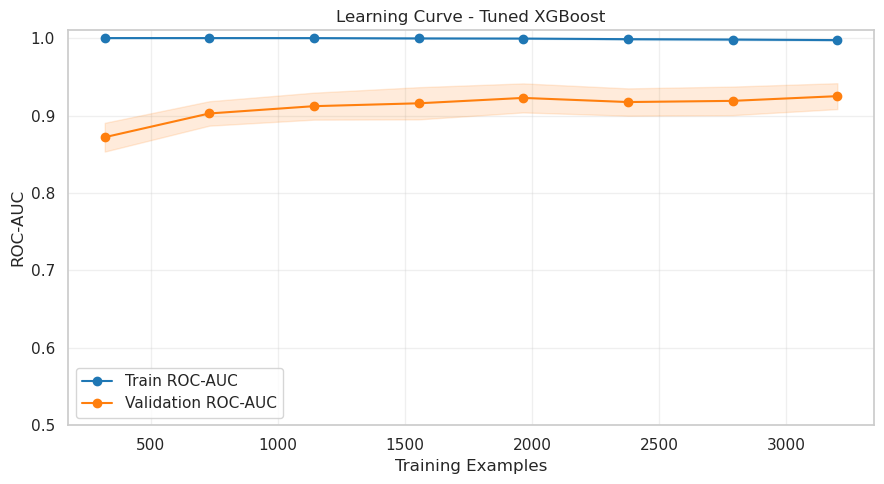
Train 0.9974 vs Validation 0.9250 (gap 0.0724) prior to regularisation.
Consistent multi‑metric gaps (>0.05) – especially recall & ROC‑AUC – showed the model was partially memorising minority churn patterns; this motivated the regularisation applied in the next step.
- Train vs Test Metrics – large drops on test indicate overfitting.
- Regularization & Final Model
- Applied depth/weight limits + subsampling + L1/L2 (
max_depth=3,min_child_weight=3,subsample=0.7,colsample_bytree=0.7,reg_alpha=1.0,reg_lambda=5.0,learning_rate=0.07, early stopping ~200 trees).
Final regularised model (train vs test) Metric Train Test Gap Accuracy 0.9710 0.9550 0.0160 Precision 0.9828 0.9138 0.0690 Recall 0.8092 0.7518 0.0574 F1 0.8876 0.8249 0.0627 ROC‑AUC 0.9560 0.9205 0.0355 Max gap 0.0690 (was 0.0909). Recall 0.0909 → 0.0574; ROC‑AUC 0.0675 → 0.0355.
- Reduced gaps (max 0.091 → 0.069) lowers overfitting risk; model ready for production scoring & churn‑risk ranking.
- Applied depth/weight limits + subsampling + L1/L2 (
- Key Metrics
Key Metrics (Final Regularised Model) Metric Value Description Accuracy 0.955 Overall correct predictions Precision 0.914 % of predicted churners who actually churned Recall 0.752 % of actual churners correctly identified F1-score 0.825 Balance between precision and recall ROC-AUC 0.921 Discrimination ability across thresholds - Balanced precision & recall with strong AUC enables confident high‑risk ranking without overwhelming retention capacity.
Key Insights
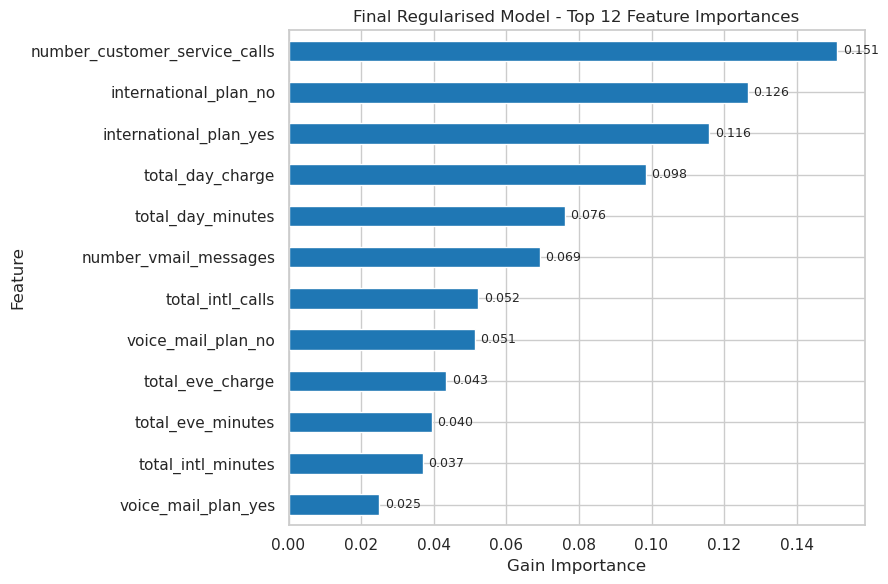
Top Features Driving Churn
- Number of customer service calls (dissatisfaction proxy)
- International plan status (misaligned pricing / usage)
- Daytime call volume & charge (usage intensity patterns)
- International call frequency & charge (cost sensitivity)
- Voicemail plan engagement (reduced stickiness when absent)
Strategic Recommendations
- Repackage international plans for high‑risk segments.
- Proactively engage customers with frequent support tickets.
- Offer usage‑based plan customisation.
- Deploy retention incentives for high international users.
- Strengthen product stickiness via feature activation campaigns.
Business Impact (Targeted Outreach Simulation)
A simulation was conducted to compare the impact of targeting the top 500 high-risk customers ranked by the model, versus contacting 500 customers at random:
| Scenario | Contacts | Actual Churners Reached | Estimated Saves (30%) | Retention Uplift |
|---|---|---|---|---|
| Random Targeting | 500 | ~71 | ~21 | 1.0× |
| Model-Based Targeting | 500 | 485 | ~145 | 5.8× |
Churn reduction: ~20% projected reduction when targeting the top 500 customers with retention actions, compared to ~3% from random outreach.
Financial angle: Assuming a $240 annual margin per retained customer, this represents ~$10K protected ARR per 500-contact cycle.